The following is an edited summary from Roskill Information Services, outlining its new report, Frac Sands & Proppants North America: Industry, Markets & Outlook 2015. The report provides a detailed technical and economic analysis of the sector. For more information and to buy the full report, visit www.roskill.com.
Over the last year North American proppant and frac sands producers have faced a whole new paradigm with lower oil prices. The North American petroleum industry and its suppliers were taken by surprise by a drop in oil prices from US$105 per barrel in June 2014 to below US$45 per barrel by the end of January 2015 (along with a quantum drop in natural gas prices).
Petroleum companies reacted quickly, and the number of drilling rigs operating halved between June 2014 and May 2015. The brunt of the drop in demand for proppants fell on ceramic- and resin-coated sand producers, as shale drillers substituted natural sand for these higher-priced proppants and suspended plans for the deep shale resource exploitation, where they are most required. However, frac sand producers have also been hit hard by falling prices, cost-cutting and consolidation.
As demand drifted away, attention became focused on cost cutting in both the oil and proppant industries, an activity for which there was little time during market expansion. Significant success has already been realized. With lower fuel prices, further savings on mining, processing and transportation will increase profitability of frac sands at lower prices. In the oil sector, according to EOG Resources, the return on investment in 2012 at US$95 per barrel oil was lower than in 2014, at US$65 per barrel oil.
The current challenges should not detract from the overall key trends in the frac sands and proppant industries. The hectic pace of shale hydrocarbon exploitation in the U.S. and Canada within the last 10 years has reversed the decline in exploitable oil and gas reserves, and pushed so-called peak oil (and gas) decades into the future. The key to unlocking vast shale oil and gas resources so quickly in North America was the explosive expansion in output of hydraulic fracturing proppants, particularly natural frac sand.
The tempo of development is unprecedented in the mineral extractive industry. Industrial sand production in the U.S. had reached a 30-year plateau of 20 to 25 megatonnes per year by 1970, with frac sand for conventional oil and gas wells accounting for 1% of its usage. Since then, a 200-fold increase in frac sand volume has occurred — most of it since 2002. By the end of 2014, natural frac sand accounted for over two-thirds of the U.S. 75 megatonnes per year production of industrial sand.
Demand for proppants, however, has not been a simple linear function of oil and gas development. Rapid changes in drilling technology and evolution of hydraulic fracturing techniques have accelerated the rate of proppant application per hole drilled, and the full potential is still to be realized.
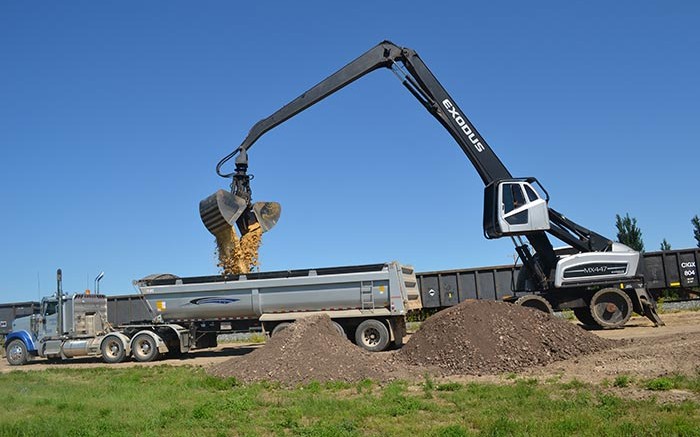
A major innovation of the proppants industry has been to take control of the logistics chain from plant loading, long distance transportation, portable storage near the destination market, transloading and “last mile” trucking to the shale drilling project. This practice for successful proppant suppliers is driving consolidation toward large, experienced companies. Small companies are becoming suppliers of washed or crude sand to some of the big operators. Another key development in the industry has been the vertical integration of a few major petroleum companies into frac sand mining and processing to ensure timely delivery of supplies.
Roskill has developed analysis techniques to forecast the variable decline in demand and prices for the three proppant types, and their expected recovery periods and future prices. This also served to identify the beginning of a major change in the dynamics of future oil and gas prices as a result of the success of hydraulic fracturing. This change might be described as the “commoditization” of oil and gas.
With the expansion of shale exploitation outside of North America, many of North America’s existing proppants producers will be in a good position to supply foreign projects and return to full capacity.
Ceramic proppants, primarily for deep, high-pressure wells, are also covered in Roskill’s report as imports play a role in the U.S. Ceramic proppants are produced by just five companies in the U.S., but by over 90 companies in the largest producer, China, two in Brazil, three in Russia and one in Italy. Chinese shipments enter North America through the port of Seattle and thence by rail to producer-owned or contracted transload facilities near shale plays in North America. Only one Russian producer serves the North American market. It ships from St. Petersburg to Duluth, Minn., via the St. Lawrence Seaway, and onward by rail to its own transload terminals near the main shale plays in the U.S. and Canada. One producer in Brazil ships to Houston, where it has contracted with a logistics/distributor for supplying market areas.


Be the first to comment on "Facts ‘n’ figures – Roskill: Innovation and consolidation in order for proppant sector"