The Lisbon-based International Copper Study Group (ICSG) has released its 2010 Statistical Yearbook covering world copper supply and demand data for the period 2000-2009. The following is an edited version of the ICSG’s summary of the yearbook, available at www.icsg.org.
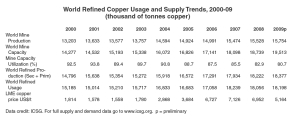
According to ICSG data, world copper mine production rose by 19% during the 10-year period, from 13.2 million tonnes in 2000 to 15.8 million tonnes in 2009. Copper in concentrates rose by 15%, while solvent extraction-electrowinning (SX-EW) production jumped by 41%. The SX-EW share of total mine production increased from 18% in 2000 to 21% in 2009. While the mine capacity-utilization rate averaged around 88% over the period, the rate fell sharply during latter years.
Over the 2008-09 period, as a result of many factors including lower head grades, labour unrest, technical problems, and temporary shutdowns or production cuts, capacity utilization averaged 82% and mine production grew by an average of only 0.9% per year. During the preceding eight years, mine production grew 2.3% per year and averaged 2% over the 10-year period.
Notable changes in annual mine production over 2000-10 included: an almost 800,000-tonne increase in Chilean production; a combined 1.8-million-tonne increase due to the revival of the African copper belt and expansions of new projects in Peru and China; and a combined decline of about 400,000 tonnes (21%) in Mexican and U.S. production. On a regional basis, production increased by 125% in Africa (600,000 tonnes), 32% in Latin America (1.7 million tonnes), 28% in Asia (700,000 tonnes) and 6% in Europe (90,000 tonnes), declined by 22% in North America (530,000 tonnes) and remained practically unchanged in Oceania (-1%).
Over the period, annual world refined production rose by 24% from 14.8 million tonnes in 2000 to 18.4 million tonnes in 2009, with an annual average growth rate of 2.5%. Primary and secondary refined production increased by 22% and 39%, respectively.
The share of secondary production in total refined production averaged 13.8% over the period and, owing to the combined effects of concentrate shortages and higher refined prices, averaged 15.4% in recent years.
Over the full 10-year period, China and India’s annual refined production together more than tripled, increasing by 2.8 million tonnes to 4.1 million tonnes, and by 455,000 tonnes to 715,000 tonnes, respectively. Chilean production rose by 600,000 tonnes to 3.3 million tonnes and significant increases in Bulgaria, the Democratic Republic of the Congo and Zambia together added around half a million tonnes of annual world refined production. In North America, production fell in the U.S. and Canada by 35% (630,000 tonnes) and by 40% (215,000 tonnes), respectively. Refined production in the EU rose by 7% to 2.5 million tonnes.
World annual refined copper usage increased by 20% over the 10-year period from 15.2 million tonnes to 18.2 million tonnes (or an annual growth rate of 2.1%). Growth was driven by China, where apparent usage over the period increased by around 5.3 million tonnes (+280%).
World usage excluding China, in fact, decreased by 17% (3.3 million tonnes) during the period, with particularly weak usage in 2008 and 2009 due to the world economic recession.
On a regional basis, usage grew in Africa by 200% (200,000 tonnes), in Asia ex-China by 7% (260,000 tonnes), and in Europe ex-EU by 55% (270,000 tonnes). Usage decreased in the Americas by 40% (1.8 million tonnes), in the EU by 30% (1.2 million tonnes) and in Oceania by 25% (45,000 tonnes).


Be the first to comment on "Copper mine output up 19% over past decade: ICSG"