
A new report by McKinsey’s energy and materials practice outlines a global mining and metals industry emerging from a few years of boom and bust and price fluctuations the consulting firm calls unprecedented in scale.
Nevertheless, says McKinsey, the industry is in healthier financial shape compared to historical averages.
From 2000 to 2023, metals and mining revenues grew by US$1.7 trillion, a jump of roughly 75% and affording the industry a 70% slice of the overall materials business which also includes plastics, pulp, and building materials. As a whole, materials represent some 7% of the global GDP.
Profits in the industry have also been robust with mining, refining and metal fabrication earnings before interest, taxes, depreciation, and amortization (EBITDA) nearly doubling over the almost quarter century going from US$500 billion to US$900 billion.
Moreover, McKinsey points out, mining and metal companies’ debt burden has decreased with a net debt over EBITDA ratios of 1.3 times, well below the through-cycle average of 1.8 times.
“However, 2024 has already proven to be a more challenging year for the industry as overall economic growth slows down and the shift toward low-carbon technologies unfolds more slowly than expected, both of which are putting downward pressure on price levels, especially for battery materials, such as nickel and lithium,” McKinsey says.
Source: McKinsey’s Global Energy & Materials Practice – Global Materials Perspective 2024; Figures in USD.
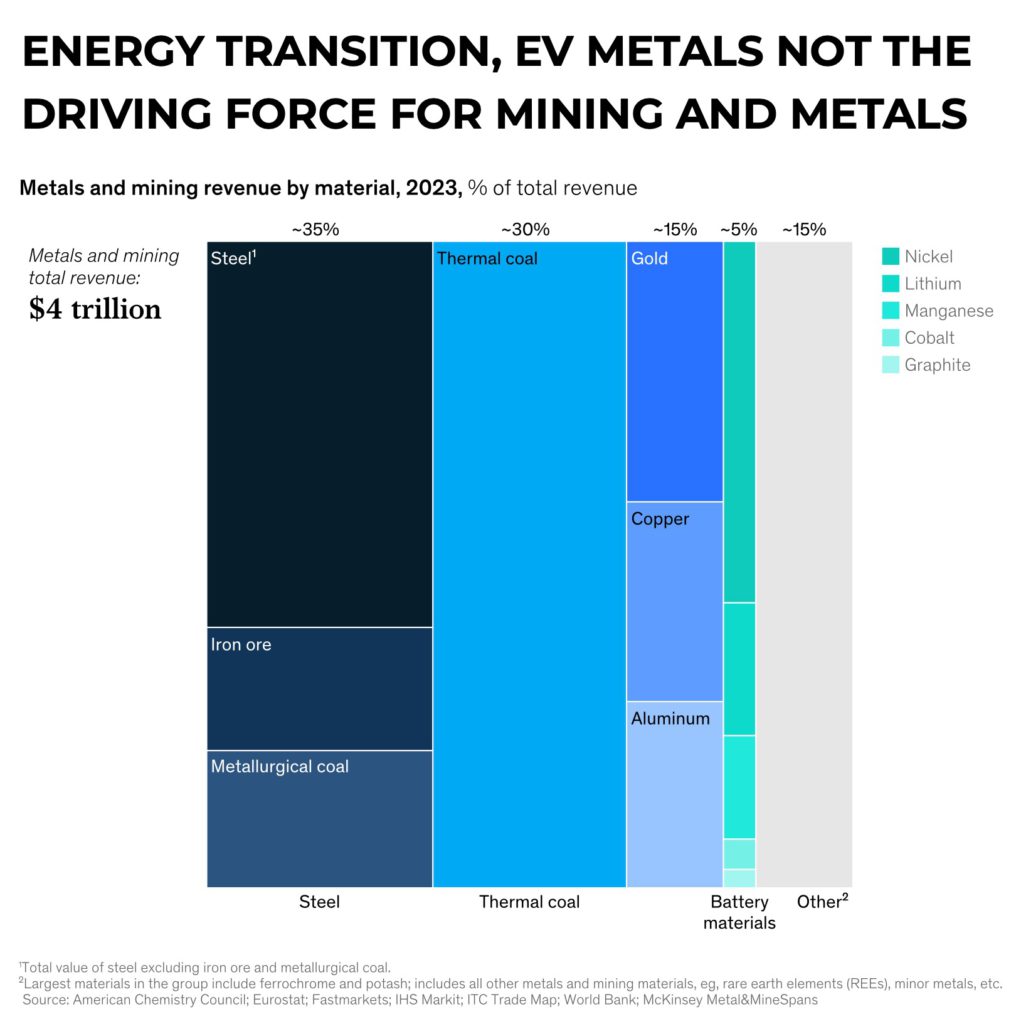
Not only are battery and other metals associated with decarbonization facing headwinds, the sector – even when lumping in bellwether copper – hardly makes up 15% of global metals and mining revenues. Until such time the copper price reaches the levels predicted by more outlandish scenarios, the share is not likely to grow much.
For instance, the market size of rare earths mining, and metal and alloy production (included in the other section of the graph) which is used in defence applications and many energy transition applications including wind turbines and motors for electric vehicles, is below US$20 billion.
Thermal coal and steel account for around 60%–70% of revenues and production volumes of 7 billion tonnes and 2 billion tonnes respectively are more than 30 times higher than all other metals and minerals combined. Output by the largest among the latter, aluminum, at roughly 100 million tonnes, does not make much of a dent in the overall total.
The bulk of mining and metals activity and revenues remains subjected to the ups and downs of the global economy, particularly the outlook for China where the signs are not great.
While the green energy transition may rightfully represent a new dawn for mining, it’s still very early in the morning.
Be the first to comment on "CHART: Global mining and metals – a reality check"